Mairangi Bay Property Market Update: June 2026

June produced three different property markets, nested inside one another. Auckland-wide, prices eased. North Shore City, one small step up. Mairangi Bay & Surrounds, up sharply, 20.8% on June 2025 and 10.1% on May. Read only the last number and you'd think the area was booming. Read all three together and a more useful, more believable story shows up: prices didn't accelerate on the way out to Mairangi Bay, the sample size did the opposite, and got a lot noisier.
REINZ's June report described the national picture as "a series of local markets moving at different speeds." That's true here too, just not in a straight line. This report walks through Auckland, North Shore, then Mairangi Bay & Surrounds, so you can see where the signal is real and where it's mostly mix.
Stats at a glance: June 2026
Metric | Mairangi Bay & Surrounds | North Shore City | Auckland Region (REINZ) | New Zealand (REINZ) |
Median sale price | $1,740,000 | $1,200,000 | $980,000 | $770,000 |
Price vs May 2026 (MoM) | +10.1% | +2.1% | -2.2% | -1.3% |
Price vs June 2025 (YoY) | +20.8% | +1.8% | -1.0% | +0.7% |
Median days to sell | 70 | 52 | 49 | 48 |
Days to sell vs May 2026 (MoM) | +24 days (from 46) | +2 days (from 50) | +3 days (from 46) | +1 day (from 47) |
Days to sell vs June 2025 (YoY) | +22 days (from 48) | +3 days (from 49) | +1 day (from 48) | -1 day (from 49) |
Sales volume | 26 | 267 | 1,772 | 5,996 |
Sales volume vs May 2026 (MoM) | -16.1% | -21.2% | -13.3% | -11.0% |
Sales volume vs June 2025 (YoY) | +8.3% | -9.8% | -5.6% | -2.9% |
House Price Index (HPI), YoY | – | – | -3.0% | -0.8% |
Sources: REINZ Statistics (individual sale records, Mairangi Bay & Surrounds and North Shore City), REINZ Monthly Property Report, June 2026, REINZ May 2026 data release (for May days-to-sell comparators), Barfoot & Thompson June 2026 market reports (for context in the sections below).
Auckland in June: prices easing, and mostly for real
Across the Auckland region, the median sale price fell to $980,000, down 2.2% on May and 1.0% on June 2025. Unlike the sales figures below, this wasn't a seasonal illusion, REINZ's seasonally adjusted figure for Auckland shows the same 2.2% monthly fall.
REINZ's House Price Index (HPI), which adjusts for the mix of what's selling rather than taking the raw median at face value, tells an even softer story for Auckland: down 3.0% year on year and 24.7% below its 2021 peak, a steeper fall than the raw median suggests. That gap between the raw median and the mix-adjusted HPI is worth remembering, it's the same effect, just running in the opposite direction, that's about to inflate Mairangi Bay & Surrounds' number further down this report.
Auckland sales volume told a bigger story on paper, 1,772 sales, down 13.3% on May and 5.6% on June 2025. But REINZ's seasonally adjusted figures show winter accounts for most of that, the seasonally adjusted monthly fall was only 6.3%. Days to sell sat at 49, three days slower than May's 46 and one day slower than June 2025, and above the region's 10-year June average of 45 days.
Where Barfoot & Thompson's own numbers sit alongside REINZ's
Barfoot & Thompson is Auckland's largest agency, selling around one in three residential homes across the city, so it's worth checking our own June figures against REINZ's whole-of-market numbers above. We sold 890 Auckland homes in June, our strongest June since 2021 and up 1.6% on the 876 we sold in June 2025. Our median selling price came in at $940,000, down 4.1% on May and 4.2% on June 2025, a little softer than REINZ's whole-of-market Auckland figure of $980,000, which reflects the particular mix of what moved through our own books rather than any disagreement between the two data sets.
On the Shore specifically, our North Shore focus area recorded 142 sales in June at an average price of $1,331,014, up 6.8% on a year ago even as volume eased from 150 sales. Fewer sales at a firmer average price, the same pattern REINZ's territorial authority figures show for North Shore City as a whole, just from inside our own portfolio rather than the full market.
North Shore City bucks the regional trend
Underneath that regional figure, Auckland's seven territorial authorities pulled in different directions. Auckland City fell 6.3% on both a monthly and annual basis, the single biggest drag on the regional median given its sales volume. Manukau City fell 4.3% monthly. Waitakere was roughly flat.
North Shore City was one of only two Auckland territorial authorities to rise on both counts: median price $1,200,000, up 2.1% on May and 1.8% on June 2025, even as sales volume fell 21.2% on May and 9.8% on June 2025 to 267. Fewer sales, at a firmer price, a genuine, sizeable-sample signal that the Shore is holding up better than most of the city.

Papakura posted the strongest annual gain of any Auckland TA (+6.1% YoY) alongside a firm +3.3% MoM, but it's a much smaller, lower-priced market, more prone to swinging on mix. Rodney's +7.7% MoM looks striking until you see its -0.9% YoY sitting right next to it, a monthly bounce, not a trend. North Shore City's 267 sales, moving the same direction on both measures, make it the more reliable read of the group.
Mairangi Bay Property Market Update June 2026: the same story, turned up, but read it carefully
Zoom into Mairangi Bay & Surrounds, and the North Shore City's modest 1.8% annual gain becomes a 20.8% jump, with a 10.1% move in a single month on top. Before treating that as ten times the strength of the wider Shore, it's worth asking what actually sold.

Of the 27 sales recorded across Mairangi Bay & Surrounds in June, 92.6% were standalone houses rather than units, townhouses or apartments, well above the 75-90% range typical of recent months, and the median number of bedrooms was four. Three sales cleared $2 million, including a $5.49 million result in Campbells Bay and a $4.375 million sale in Mairangi Bay. At the same time, a third of all sales (9 of 27) came in under $1.2 million.
That spread, cheap end and expensive end both well represented, middle-market houses relatively scarce, is exactly the pattern that pulls a small-sample median around without reflecting a genuine shift in what any individual property is worth. With only 26-27 sales in the month, it takes just two or three unusually large results to move the median meaningfully, in a way it wouldn't in a 267-sale sample like North Shore City's. Treat the 20.8% headline as noise amplified by a thin, premium-skewed sample, not a genuine acceleration beyond what North Shore City itself is already showing.
The number that actually matters: 70 days to sell
While the median price grabbed attention, days to sell moved just as sharply, and in a way that's harder to explain away as mix. Properties across Mairangi Bay & Surrounds took a median of 70 days to sell in June, up 24 days on May's 46 and up 22 days on the 48 recorded in June 2025.
That's a materially sharper slowdown than the wider market. North Shore City's median days to sell rose only 2 days month on month and 3 days year on year over the same periods. And this one isn't a couple of outliers, of the 26 June sales with a recorded selling time, 10 took more than 99 days, spread across every suburb in the patch and across both auction and private treaty, not concentrated in one pocket or one price band. Whatever is slowing down in Mairangi Bay & Surrounds right now is more local than it is regional, and it's showing up in pace well before it shows up convincingly in price.
The rolling 12-month view: a different story
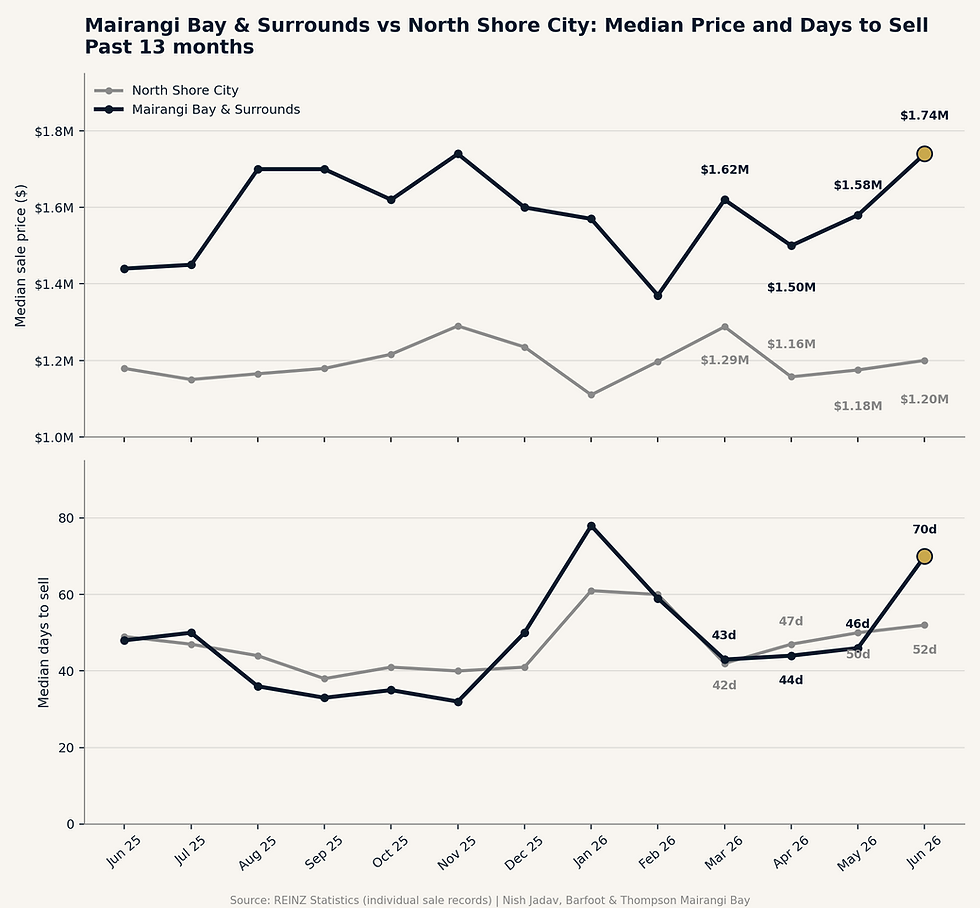
Single-month figures for an area this size move around a lot, June's sample was 26 sales, so it's worth checking June against the trend rather than just against one prior month. Pooling every recorded sale across Mairangi Bay & Surrounds over the trailing 12 months (July 2025 to June 2026, 444 sales), the underlying median sale price sits at $1,577,500 and the underlying median days to sell is 44. Compared with that rolling trend, June's $1,740,000 median and 70-day selling time both sit well above the norm, not just above last month or last June.
North Shore City tells a steadier version of the same story. Over the same trailing 12 months, the average sale price across the wider area works out to roughly $1,372,000 across 4,060 sales, with an average monthly median of 47 days to sell, both close to where June itself landed.
Read together, the rolling data doesn't contradict the MoM and YoY numbers above, June genuinely was pricier and slower than usual in Mairangi Bay & Surrounds. But it puts the size of the move in context: one unusually strong, unusually slow month sitting on top of a rolling trend that's been considerably more settled, layered on top of a North Shore City trend that's holding up, but nowhere near as dramatically as the headline suggests.
It depends which street you're on
Zooming in further, the June slowdown wasn't even across the patch. Looking at the second quarter (April to June) by suburb:

Suburb | Median sale price (Q2 2026) | Median days to sell | Sales (n) |
Campbells Bay | $2,210,000 | 105.5 | 8 |
Mairangi Bay | $1,590,000 | 63 | 23 |
Rothesay Bay | $1,535,500 | 46 | 28 |
Murrays Bay | $1,551,400 | 34.5 | 24 |
Windsor Park | $1,355,000 | 40 | 6 |
Campbells Bay commanded the highest prices this quarter, but properties there also took more than three times as long to sell as those in Murrays Bay. A high median price and a fast sale aren't the same thing, and this quarter they didn't come as a package deal anywhere in the area.
For investors, Barfoot & Thompson's own suburb data (drawn from our sales and rental books) puts three-bedroom averages at $1,200,667 in Mairangi Bay, a 3.40% gross yield, and $1,079,000 in Rothesay Bay, a 3.86% yield. We don't yet have enough tenancy and sales volume to report reliable figures for Murrays Bay, Campbells Bay or Windsor Park, but these two are a useful reference point for the wider patch.
What this means if you're selling, buying or staying put
If you're preparing to sell, the takeaway isn't "prices are up 20%, list high and wait." North Shore City's genuine, larger-sample trend is a modest, real firming, not a 20% jump. Well-priced, well-presented homes are still finding buyers, but the timeline has stretched noticeably, and buyers are being more selective about what they'll wait for. We covered the mechanics of getting a fair result under these conditions in our May market report, and if you're weighing up auction versus private treaty in a slower-paced market, our guide to how auctions really work is worth a read before you decide.
If you're buying, a longer days-to-sell window generally means more room to negotiate on price and conditions than the median headline suggests, particularly outside the premium end of the market where most of June's volume actually sat.
If you're staying put, a single month's 20.8% jump in the reported median isn't a reliable guide to what your specific property is now worth, the rolling 12-month figure and the North Shore-wide trend above are the steadier reference points. Local mix effects like the ones behind this month's figure are exactly why council valuations and headline medians can mislead. We've unpacked some of the more common ones in our piece on valuation myths.
As always, for a view on what your own property is likely worth in the current market, get in touch for a current appraisal rather than relying on the suburb median.

The tl;dr version:
Q: Did Mairangi Bay house prices really rise 20% in June 2026?
A: The reported median rose 20.8% year-on-year to $1,740,000, but this reflects a small, premium-skewed sample of 26-27 sales rather than broad-based price growth. North Shore City's wider, larger-sample trend rose a more modest 1.8% over the same period.
Q: How long does it take to sell a house in Mairangi Bay right now?
A: In June 2026, the median time to sell across Mairangi Bay & Surrounds was 70 days, up from 48 days a year earlier.
Q: Is North Shore outperforming the rest of Auckland's property market?
A: Yes. North Shore City was one of only two Auckland territorial authorities to record a price rise on both a monthly and annual basis in June 2026, while the wider Auckland region median fell 2.2% month-on-month.
Q: What is the median house price in Mairangi Bay & Surrounds?
A: $1,740,000 as at June 2026, according to REINZ sales data.
Data sources: REINZ Statistics (individual sale records for Mairangi Bay, Rothesay Bay, Murrays Bay, Campbells Bay, Windsor Park and North Shore City), the REINZ Monthly Property Report, June 2026, and Barfoot & Thompson's June 2026 market reports.


Comments