North Shore Property Market Update: July 2026


July was the month the interest rate story changed direction, and the North Shore was the one part of Auckland that did not flinch. Across Auckland's seven territorial authorities, only one recorded a higher median price than July last year, and it was North Shore City, up 0.9 percent to $1,160,000. Every other TA in the region was flat or down. That is a small number doing a lot of work, and it is worth understanding before you read anything else about Auckland in July.
Closer to home, in Mairangi Bay & Surrounds the story was about composition rather than direction. Twenty-six sales settled at a median of $1,380,000, which reads as a sharp drop until you look at what actually sold: a thin, entry-weighted month with almost nothing transacting above $2.2 million and a lot of cross-lease stock clearing.
Meanwhile properties sold faster than they have in months, at a median of 39 days. Slower prices and faster sales in the same month is not a contradiction. It tells you buyers are still there, they are just buying differently.
Stats at a glance: July 2026
Mairangi Bay & Surrounds compared with North Shore City, the Auckland region and New Zealand. All figures are for the month of July 2026, to 31 July.
Measure | Mairangi Bay & Surrounds | North Shore City | Auckland Region | New Zealand |
Median price | $1,380,000 | $1,160,000 | $940,000 | $760,000 |
Month on month | −13.2% | −2.9% | −4.1% | −1.9% |
Year on year | −4.8% | +0.9% | −3.6% | −0.7% |
Median days to sell | 39 days | – | 50 days | 50 days |
Month on month | −13 days | – | +1 day | – |
Year on year | −11 days | – | +2 days | +2 days |
Sales | 26 | 278 | 1,878 | 6,090 |
Month on month | −16.1% | −2.8% | +1.3% | −1.2% |
Year on year | −21.2% | −13.4% | −8.9% | −10.0% |
HPI, year on year | – | – | −1.7% | −0.4% |
A dash means REINZ does not publish that measure at that level. Days to sell is not reported for individual territorial authorities, and the House Price Index is only produced regionally and nationally. Nothing here is estimated.
Auckland in July
Nationally the median price was $760,000, down 0.7 percent on July last year and down 1.9 percent on June. Sales came in at 6,090, which is 10.0 percent below July 2025 but sits close to the historical midpoint for the month across REINZ's 35 years of records. What has genuinely shifted is pace. National days to sell reached 50, two days longer than a year ago and the fifth slowest July on record, and inventory is up 9.3 percent nationally, driven more by properties taking longer to sell than by a flood of new listings. New listings were actually down 0.5 percent.
Auckland sat slightly softer than the country. The regional median was $940,000, down 3.6 percent on the year and down 4.1 percent on June. Sales of 1,878 were 8.9 percent below last July, though they did tick up 1.3 percent from June, so the volume floor is holding. Days to sell was 50 against a ten year July average of 43, and the region now carries 32 weeks of inventory, three weeks more than the same time last year. The Auckland House Price Index is down 1.7 percent on the year.
REINZ chief executive Lizzy Ryley framed it this way: "There is still activity in the market with people buying and selling property every day. What has changed is the pace. Buyers are taking time to carefully consider their options, and sellers are sometimes allowing more time for the right buyer to come along."
Where Barfoot & Thompson's own numbers sit alongside REINZ's
Our own Auckland figures for July were steadier than the REINZ regional picture, which is a useful cross-check because the two datasets cover different slices of the same market.
Measure | July 2026 | vs June 2026 | vs July 2025 |
Sales | 845 | −5.1% | −11.7% |
Median price | $945,000 | +0.5% | −0.5% |
Average price | $1,102,469 | −0.5% | +0.2% |
New listings | 1,551 | +6.4% | −3.4% |
Stock at month end | 5,943 | −1.6% | −2.2% |
Two things stand out. Our median was up 0.5 percent on June while the REINZ regional median was down 4.1 percent, and our year on year median change was only 0.5 percent softer against REINZ's 3.6 percent. Different sales mixes will do that, and it is a reminder that a single monthly median is a blunt instrument. As Peter Thompson, our managing director, put it: "Sales and prices remained consistent with where they were in May and June. It was a good solid month's trading."
For the North Shore focus area specifically, we recorded 148 sales in July at an average sale price of $1,289,717. The other number worth flagging is stock: at 5,943 properties we finished July with less on our books than a year ago, down 2.2 percent, even as region-wide inventory rose. Fewer listings competing for the same buyers is not a bad backdrop for a vendor going to market in spring.
North Shore City holds its ground

Territorial authority | Median price | vs June | vs July 2025 | Sales | Sales vs July 2025 |
North Shore City | $1,160,000 | −2.9% | +0.9% | 278 | −13.4% |
Rodney District | $1,055,000 | −6.2% | −1.4% | 211 | +3.4% |
Auckland City | $1,042,000 | −7.4% | −5.3% | 497 | −7.8% |
Manukau City | $857,500 | −5.2% | −4.7% | 420 | −13.4% |
Waitakere City | $852,000 | 0.0% | −0.5% | 298 | −17.5% |
Franklin District | $845,000 | +3.0% | −1.7% | 98 | +24.1% |
Papakura District | $810,000 | +5.3% | 0.0% | 76 | +5.6% |
Auckland Region | $940,000 | −4.1% | −3.6% | 1,878 | −8.9% |
North Shore City remains the most expensive TA in the region at $1,160,000, a $220,000 premium to the regional median, and it is the only one that has grown on the year. The 2.9 percent slip from June is smaller than Auckland City's 7.4 percent or Rodney's 6.2 percent, so the Shore is also the steadier of the higher priced areas.
The outlier worth a line of colour is Franklin District. Its median fell 1.7 percent on the year, but sales jumped 24.1 percent, the strongest volume growth in the region by a wide margin. That is a market clearing stock at the entry level rather than a market appreciating, and it is the mirror image of what happened in the Bays in July.
Mairangi Bay & Surrounds in July
The area median of $1,380,000 was down 13.2 percent on June and 4.8 percent on July last year. Before reading that as a fall in value, look at what transacted. July's 26 sales made it one of the thinner months of the last thirteen, the fifth lightest of the run, and the sales that did happen clustered low. Only four of the month's dwelling sales cleared $2 million, and just one cleared $2.2 million: 69A Kowhai Road in Mairangi Bay, a five bedroom, 376 square metre home on 1,461 square metres, which sold by negotiation for $3,600,000 after 92 days. Take that single sale out and the top of the market barely participated in July at all.
At the same time the area sold faster than it has since November. Median days to sell came in at 39, down 13 days on June and 11 days on July last year, at a point when both Auckland and New Zealand were slowing to 50 days. Well priced, well presented stock in the Bays is not sitting.
What the last twelve months of stock actually looks like
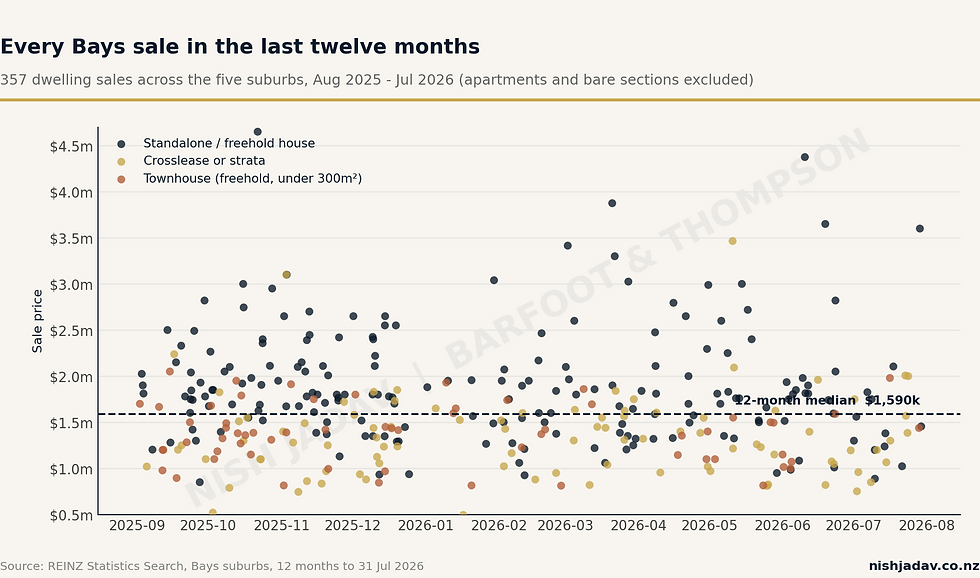
Across the twelve months to 31 July 2026 there were 357 dwelling sales in the five suburbs, at a median of $1,590,000 and an average of $1,715,994. Apartments and bare sections are excluded, and one multi-unit parcel sale was set aside as not comparable to a single dwelling. Median days to sell over the full year was 41.
Measure | Value |
Dwelling sales | 357 |
Median sale price | $1,590,000 |
Standalone freehold houses | 56.9% |
Crosslease or strata | 25.8% |
Townhouses, freehold under 300m² | 17.4% |
Median bedrooms | 4 |
Median days to sell | 41 days |
Sales taking more than 90 days | 50 of 295 reported |
Two numbers there deserve attention. Just under 57 percent of what sold was a standalone freehold house, meaning more than four in ten Bays sales were crosslease, strata or townhouse title. If you own a standalone home on its own title you are competing in a smaller pool than the raw sales count suggests. And 50 of the 295 sales with a reported campaign length took more than 90 days. That is roughly one in six. The median of 41 days is real, but so is the long tail, and the difference between the two usually comes down to pricing at the start of the campaign rather than anything about the property.
Price band | Sales | Share |
Under $1.0m | 37 | 10.4% |
$1.0m to $1.25m | 48 | 13.4% |
$1.25m to $1.5m | 72 | 20.2% |
$1.5m to $1.75m | 65 | 18.2% |
$1.75m to $2.0m | 61 | 17.1% |
$2.0m to $2.5m | 39 | 10.9% |
$2.5m and above | 35 | 9.8% |
Total | 357 | 100% |
The thickest part of the Bays market is $1.25m to $2.0m, which accounts for 55.5 percent of everything sold in the last year. Above $2.5 million there were 35 sales in twelve months, roughly three a month across five suburbs, so at that level individual results move the median far more than any trend does.
The rate story changed direction in July
On 8 July the Reserve Bank raised the Official Cash Rate by 25 basis points to 2.50 percent, its first increase since 2023. The reasoning was that the recovery had lost momentum in the June quarter after an oil price shock, but that 2.25 percent was "somewhat below neutral, so stimulative", and some of that stimulus needed to come out.

All five major bank economics teams now expect more increases before the end of the year, with most forecasting the OCR reaching around 3 percent by December through hikes in September and October. ASB puts the neutral rate at roughly 3.25 percent. This is not a return to 2022 territory, but the direction of travel for borrowers has reversed.
There is a second force acting on mortgage rates that has nothing to do with the Reserve Bank. Wholesale funding costs have climbed on Middle East geopolitical tension: one year swap rates went from just above 3 percent in early July to 3.43 percent by month end, and two year swaps from 3.36 percent to 3.70 percent. ANZ, Westpac and BNZ have all lifted fixed rates in response.

In practical terms, someone refixing a $600,000 mortgage for one year at 4.99 percent is paying about $73 a month more than they would have a fortnight earlier. Cheaper mortgages have been the main thing working in buyers' favour for the past eighteen months, and that support is now being withdrawn from both ends at once.
Then there is the political layer. The general election is in November, and REINZ members are reporting a 'wait and see' approach becoming more evident among some buyers, sellers and investors. Ryley's read: "Our members are telling us they're seeing less urgency around some property decisions as the election gets closer, with some buyers or sellers opting to wait and see how conditions develop. At the same time, there are many reasons people are looking to buy or sell. Families grow, people relocate and housing needs change, and those changing circumstances keep the market moving."
Worth being clear about what this does and does not mean locally. Election-year hesitancy tends to compress activity into the windows either side of the date rather than remove it. If rates keep rising and a cohort of buyers is holding for November, the practical effect for the Bays is that the spring window before the election is likely to be the more competitive one for vendors, and the quieter stretch immediately around it the more competitive one for buyers.
The rolling 12 months in context

Over thirteen months the area median has oscillated between $1.37m and $1.74m without establishing a trend in either direction. July 2026's $1.38m is close to the bottom of that band, but so was February's $1.37m, and March promptly rebounded to $1.62m. In a market averaging roughly 30 sales a month, one quiet month at the top end moves the median more than any change in underlying value does.
The days to sell panel is the more informative of the two. After the January blowout to 78 days, the trend has been steadily improving, and July's 39 days is the fastest reading since November 2025. Prices bounce around; the time it takes to find a buyer has been quietly getting better for six months.
It depends which street you're on
The twelve month window is too coarse for suburb comparison and a single month is too thin, so this uses the rolling quarter from 1 May to 31 July 2026: 89 dwelling sales at an area median of $1,520,000 and 44.5 days to sell.

Suburb | Sales | Median price | Median days to sell |
Campbells Bay | 8 | $1,816,000 | 72.5 |
Mairangi Bay | 27 | $1,590,000 | 60.5 |
Murrays Bay | 26 | $1,477,500 | 40.0 |
Rothesay Bay | 23 | $1,385,000 | 38.5 |
Windsor Park | 5 | $1,238,000 | 49.0 |
Mairangi Bay & Surrounds | 89 | $1,520,000 | 44.5 |
There is a clean $578,000 spread from Campbells Bay at the top to Windsor Park at the bottom, and it comes with an inverse relationship to speed. The two most expensive suburbs are also the two slowest, at 72.5 and 60.5 days, while Rothesay Bay and Murrays Bay are turning over in under six weeks. Higher price points take longer because the buyer pool is thinner, which matters when you are setting expectations at the start of a campaign rather than discovering it in week eight.
Read Campbells Bay and Windsor Park with care. Eight sales and five sales respectively over three months is not enough for a reliable median, and a single large or small result will swing them. Mairangi Bay, Murrays Bay and Rothesay Bay all have enough volume to be meaningful.
For investors: three bedroom yields
These come from Barfoot & Thompson's own July Suburb Report, matching three bedroom sale prices against three bedroom rents in the same suburb.
Suburb | Average sale price | Average weekly rent | Gross yield |
Rothesay Bay | $1,100,000 | $800 | 3.78% |
Mairangi Bay | $1,324,429 | $786 | 3.08% |
Murrays Bay | $1,800,816 | $742 | 2.14% |
Campbells Bay | Not reported, fewer than four qualifying sales or tenancies | ||
Windsor Park | Not reported, fewer than four qualifying sales or tenancies |
Neighbouring suburbs for context: Milford 3.41%, Torbay 3.38%, Browns Bay 3.19%, Takapuna 2.04%. Campbells Bay and Windsor Park are routinely below the reporting threshold, which is expected in small suburbs rather than a gap in the data.
Rothesay Bay is the clear yield play in the area at 3.78 percent, ahead of every neighbouring suburb listed, because it combines the lowest three bedroom average price in the Bays with the highest average rent. Murrays Bay at 2.14 percent is the opposite: buyers there are paying for the location and the schools, not the rent roll. With one year money at 4.75 percent and rising, none of these yields cover debt servicing on their own, so the Bays remain a capital growth and lifestyle market rather than a cashflow one.
Recent sales across the Bays
Address | Suburb | Bed | Title | Sale price | Method | Days | Date |
1/98 Park Rise | Campbells Bay | 4 | Crosslease | $1,495,000 | Auction | 64 | 13 Aug |
1/49 Hastings Road | Mairangi Bay | 5 | Crosslease | $2,237,000 | Auction | 40 | 12 Aug |
1/2 Jutland Street | Mairangi Bay | 3 | Crosslease | $1,276,000 | Auction | 30 | 10 Aug |
Lot 4/14 Cloverly Crescent | Campbells Bay | 4 | Townhouse | $1,358,000 | Negotiation | 101 | 10 Aug |
32 Amante Crescent | Mairangi Bay | 5 | Freehold | $2,000,000 | Auction | 36 | 6 Aug |
346A Beach Road | Mairangi Bay | 3 | Freehold | $1,275,000 | Auction | 50 | 5 Aug |
1/29 Aberdeen Road | Campbells Bay | 3 | Crosslease | $1,357,000 | Auction | 49 | 5 Aug |
3 Milenio Crescent | Windsor Park | – | Freehold | $1,190,000 | Negotiation | 1 | 5 Aug |
9 Saddleback Rise | Murrays Bay | 4 | Freehold | $1,455,000 | Negotiation | 40 | 29 Jul |
2/1 Montana Avenue | Murrays Bay | 4 | Townhouse | $1,438,000 | Negotiation | 140 | 29 Jul |
69A Kowhai Road | Mairangi Bay | 5 | Freehold | $3,600,000 | Negotiation | 92 | 28 Jul |
2/13 Braemar Road | Rothesay Bay | 4 | Crosslease | $1,385,000 | Auction | 39 | 23 Jul |
2/41 Hastings Road | Mairangi Bay | 4 | Crosslease | $2,000,000 | Negotiation | 66 | 23 Jul |
23A Penguin Drive | Murrays Bay | 5 | Freehold | $1,023,000 | Auction | 37 | 23 Jul |
454B Beach Road | Murrays Bay | 5 | Crosslease | $1,570,000 | Negotiation | 65 | 22 Jul |
2/98 Park Rise | Campbells Bay | 3 | Crosslease | $2,007,000 | Negotiation | 30 | 21 Jul |
August sales are shown here for currency but are deliberately excluded from every headline figure above, which all close at 31 July 2026. Days is days on market at the point of sale.
What this means if you're selling, buying or staying put
If you're selling
The rate window is closing, not opening. Buyers looking at a 4.75 percent one year rate today were looking at low fours a fortnight ago, and the consensus is the OCR reaches 3 percent by December. If you have been waiting for a better market, the borrowing capacity of your buyer pool is more likely to be smaller in six months than larger. Against that, the local fundamentals are on your side: 39 days to sell in July, the fastest since November, and our own Auckland stock down 2.2 percent year on year. The one in six campaigns that ran past 90 days is the risk to manage, and in almost every case that is a pricing decision made in week one, not a market problem discovered in week twelve.
If you're buying
You have more genuine negotiating room than at any point in the last two years, particularly above $2 million, where only 20.7 percent of the last twelve months' sales occurred and campaigns are running 60 to 72 days in Campbells Bay and Mairangi Bay. Get your finance approved on current rates rather than the rates you were quoted a month ago, because the numbers have moved and they may move again in September. If value per dollar matters more than address, Rothesay Bay at a $1,385,000 quarterly median and 38.5 days is where the Bays' price to quality ratio is strongest right now.
If you're staying put
North Shore City is the only Auckland TA whose median is above where it was a year ago, so on a twelve month view your position has been better than almost anywhere else in the region. If you are refixing in the next six months, get quotes now and think about term rather than assuming short is automatically cheapest for the whole period: six months at 4.65 percent looks good today, but if the OCR is 3 percent by December you will be refixing into a higher curve. Worth a conversation with your broker before the September review.
Curious what your place is worth in this market, not last year's?
Before you go
I'm Nish, a residential salesperson here in Mairangi Bay, licensed as a Branch Manager under REAA 2008. I work alongside Charlotte Goudge, also a residential salesperson, across Mairangi Bay and the East Coast Bays. Between us we track this market street by street, not just suburb by suburb, and in a month like July that matters more than usual, because a single $3.6 million sale on Kowhai Road can move the whole area median while telling you nothing about your own street.

Want to know where your home actually sits in this market? Get a free appraisal.
The tl;dr version
How is the North Shore property market performing in July 2026?
North Shore City recorded a median sale price of $1,160,000 in July 2026, up 0.9 percent on July 2025 and down 2.9 percent on June. It was the only one of Auckland's seven territorial authorities with a median above where it was a year ago. Sales of 278 were down 13.4 percent year on year, and it remains the region's most expensive TA, $220,000 above the Auckland median of $940,000.
What is the median house price in Mairangi Bay & Surrounds?
The median sale price in Mairangi Bay & Surrounds was $1,380,000 in July 2026, from 26 sales. That is down 13.2 percent on June and 4.8 percent on July 2025. Over the full twelve months to 31 July 2026 the median across 357 dwelling sales was $1,590,000, which is the more reliable figure for a market of this size.
Which Bays suburb has the highest and lowest median price?
Over the rolling quarter from 1 May to 31 July 2026, Campbells Bay was highest at $1,816,000 from 8 sales and Windsor Park lowest at $1,238,000 from 5 sales. In between: Mairangi Bay $1,590,000, Murrays Bay $1,477,500 and Rothesay Bay $1,385,000. Campbells Bay and Windsor Park have low sale counts, so treat those two medians as indicative.
How long is it taking to sell a house in the East Coast Bays?
Median days to sell in Mairangi Bay & Surrounds was 39 days in July 2026, down 13 days on June and 11 days on July 2025, and the fastest reading since November 2025. Both Auckland and New Zealand sat at 50 days. Across the full twelve months the local median was 41 days, though one in six campaigns ran past 90 days.
What happened to interest rates in July 2026?
The Reserve Bank raised the Official Cash Rate by 25 basis points to 2.50 percent on 8 July 2026, the first increase in three years. All five major bank economics teams expect the OCR to reach roughly 3 percent by the end of 2026. Fixed mortgage rates are also rising independently on higher wholesale funding costs, with the lowest main-bank one year special at 4.75 percent in early August.
Is the November election affecting the property market?
REINZ reports that a 'wait and see' approach is becoming more evident among some buyers, sellers and investors ahead of the November general election, with less urgency around property decisions. Election-year hesitancy tends to compress activity into the windows either side of the date rather than remove it, so the practical local effect is a busier spring for vendors and a quieter stretch around November for buyers.
What is the rental yield on a three bedroom in the Bays?
On Barfoot & Thompson's July 2026 Suburb Report, gross yields on three bedroom properties were 3.78 percent in Rothesay Bay, 3.08 percent in Mairangi Bay and 2.14 percent in Murrays Bay. Campbells Bay and Windsor Park had too few qualifying sales or tenancies to report. With one year fixed money at 4.75 percent, none of these cover debt servicing from rent alone.
Data sources and disclaimer. Area and suburb figures are derived from the REINZ Statistics Search export for Campbells Bay, Mairangi Bay, Murrays Bay, Rothesay Bay and Windsor Park, and the REINZ Market Insights Report for Mairangi Bay & Surrounds. National, regional and territorial authority figures are from the REINZ New Zealand Property Report for July 2026, published 13 August 2026. Barfoot & Thompson figures are from our Housing Market Update, Residential Sales Report and Suburb Report for July 2026, published 4 August 2026. Interest rate data is from the Reserve Bank of New Zealand and interest.co.nz. All headline statistics cover the period to 31 July 2026; August sales appear in the recent sales table only. Apartments, bare sections and one multi-unit parcel sale are excluded from dwelling aggregates. Medians drawn from small samples are noted as such. This article is general market commentary and not valuation, financial or legal advice. Figures for individual properties will vary with condition, aspect, land, zoning and title. Speak to a licensed professional about your specific circumstances.


Comments